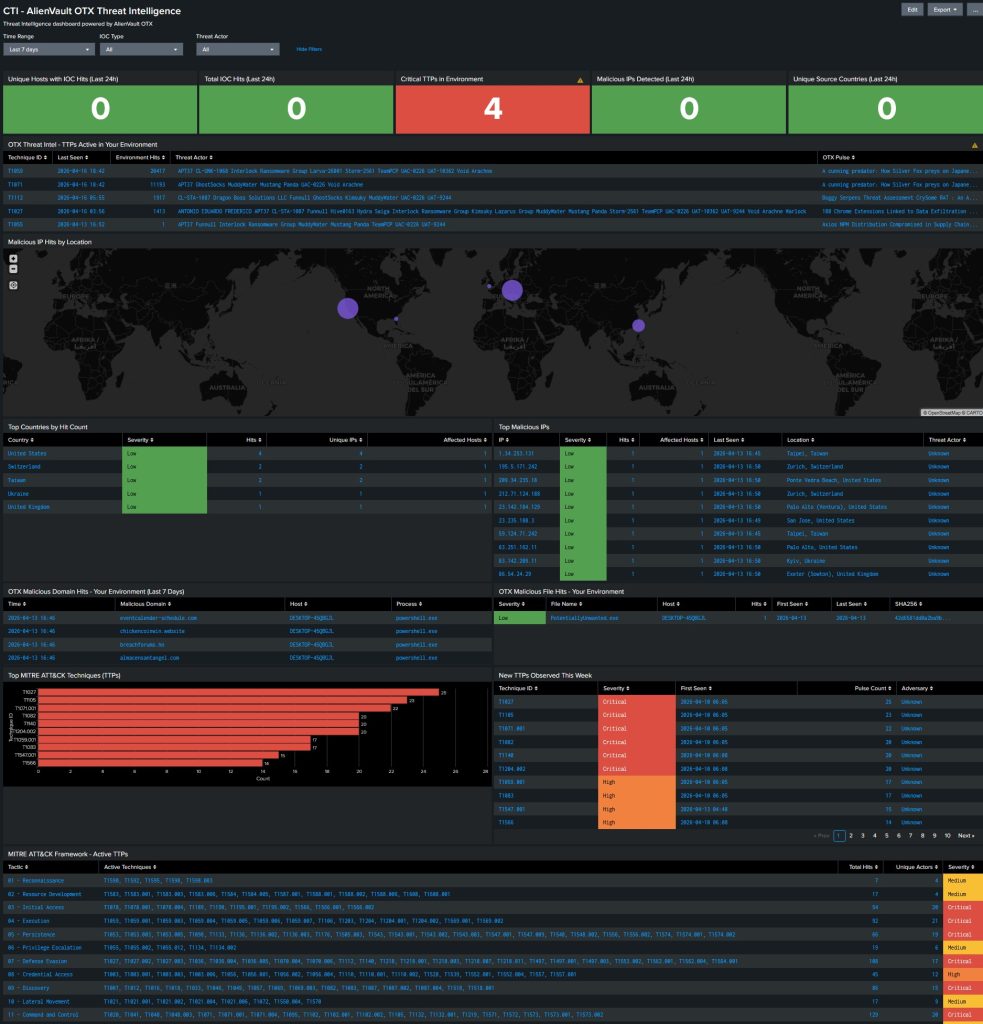
For the ECA Cyber Range Splunk Security Dashboard Challenge, I built a CTI dashboard that correlates AlienVault OTX threat intelligence against live Sysmon endpoint telemetry.
The idea is simple. OTX publishes malicious IPs, domains, file hashes, and adversary TTPs. Sysmon captures everything happening on your Windows endpoints. The dashboard joins those two data sources and answers one question: which of those threats are my machines actually talking to right now?
The Data Sources
OTX data lands in Splunk via the TA-otx Add-on in two sourcetypes. otx:pulse holds threat actor and campaign metadata. otx:indicator holds individual IOCs. The add-on polls the OTX API on a scheduled interval and checkpoints where it left off.
On the endpoint side, Sysmon captures network connections (EventCode=3), DNS queries (EventCode=22), process creation (EventCode=1), file writes (EventCode=11), registry modifications (EventCode=13), image loads (EventCode=7), and remote thread creation (EventCode=8).
How the Correlation Works
The core of every environment panel is a Splunk subsearch join. Here’s the domain hits panel as an example:
spl
index=sysmon EventCode=22
| rename QueryName as indicator
| join type=inner indicator [
    search index=otx sourcetype="otx:indicator" type="domain" earliest=0
    | dedup indicator
    | fields indicator
  ]
Sysmon captures DNS queries. OTX has a list of malicious domains. The join returns only the domains that appear in both. If there’s no match, nothing shows. Every result is confirmed.
The same pattern applies for IPs (EventCode=3 against OTX IPv4 indicators) and file hashes (SHA256 extracted from Sysmon Hashes field against OTX FileHash-SHA256 indicators).
TTP Correlation
The TTP panel goes a step further. Instead of matching on IOC values, it maps Sysmon event codes to MITRE ATT&CK technique IDs and joins against OTX pulse data.
spl
| eval technique_id=case(
    EventCode=1 AND match(Image,"powershell.exe|cmd.exe"), "T1059",
    EventCode=8,  "T1055",
    EventCode=11, "T1027",
    EventCode=13, "T1112",
    EventCode=22, "T1071",
    EventCode=3,  "T1071",
    true(), null()
  )
If T1059 is firing in your environment AND OTX has pulses referencing T1059, it surfaces with the associated threat actors and pulse names. It’s not just “PowerShell ran” — it’s “PowerShell ran and known threat actors are using this technique right now.”
Testing It
I used Invoke-AtomicRedTeam to simulate adversary techniques and generate real Sysmon telemetry. Running tests for T1059, T1055, T1027, T1112, and T1071 immediately populated the TTP panels. For the IP panels, I pulled a list of malicious IPs from OTX and ran connection attempts against them to trigger EventCode=3 events.
What I Would Do Differently in Production
After making this and reviewing it, I would remove the “Severity” column. How to define Severity? Total hits, counts in OTX pulses, combination of the two? If an IP gets hit just once and only occasionally, that could be a C2 server getting a ping.
Also, the TA-otx add-on polls hourly. In a real SOC environment you would replace that with TAXII 2.1 to receive indicator pushes in real time the moment OTX publishes them. You would also use Splunk Enterprise Security’s native Threat Intelligence framework instead of raw subsearch joins, and replace the hardcoded MITRE tactic mapping with ES’s maintained lookup table.
The detection logic is the same. The plumbing is just faster.